
gold price graph 2025
gold price graph The year 2025 has been remarkable for gold. From global markets to Bangladesh’s local bullion rates, gold has surged to new highs, shaped by macro-economic forces, geopolitical shocks and investor appetite for safe-haven assets. Through the lens of the “gold price graph 2025”, this article offers a detailed look at:
- Global gold price trends and data
- Bangladesh gold price movements and how they compare
- Key drivers behind the surge
- Forecasts & what happens next
- How you can read and interpret the gold price graph
- Implications for investors, consumers and the economy
Global Gold Price Graph 2025: Data & Trends
Recent Data
- According to Trading Economics, spot gold hit US $4,347.29 per troy ounce on 20 October 2025. Trading Economics+2Goldman Sachs+2 gold price graph 2025
- The price is up about 59.75% year-on-year (y/y) for the same period. Trading Economics
- The World Gold Council (WGC) reported a 26 % rise in USD terms in the first half of 2025. World Gold Council
- Forecasts: HSBC raised its average 2025 forecast to US$3,215/oz in July. Reuters
- Goldman Sachs sees gold reaching US $3,700/oz by end-2025 and potentially US $4,000/oz+ into 2026. Goldman Sachs+1 gold price graph 2025
- Some reports indicate it already crossed US $4,000/oz in early October 2025. The Guardian+1 gold price graph 2025
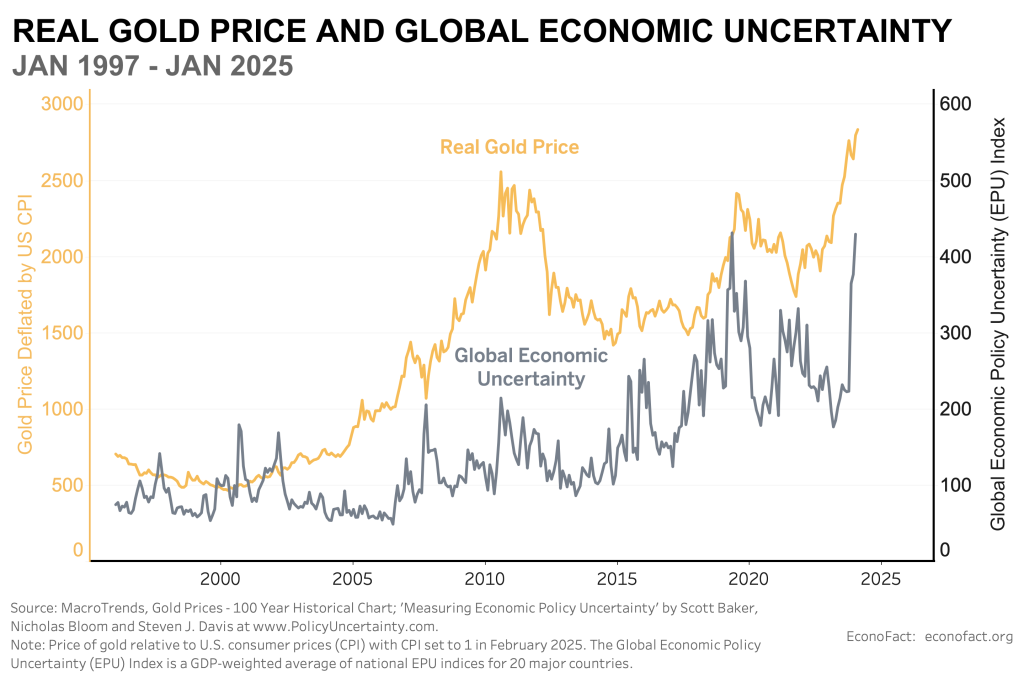
What the Graph Shows (Visualize)


6
From the chart you can observe:
- A steady climb from early 2025 through Q1-Q3, with steeper raises after mid-year.
- Spikes corresponding to major economic or geopolitical events (tariffs, central bank actions, etc.).
- Periods of consolidation or minor pull-backs but the trend remains strongly upward.
- The slope of the curve steepens into Q3-Q4, showing accelerating price appreciation.
Bangladesh Gold Price Graph 2025: Local Dynamics
Local Data
- For Bangladesh, the gold price for 24-karat per ounce (or per bhori/vori) soared. As per Exchange-Rates.org, in March: lowest Tk 350,185/oz and highest Tk 379,216/oz for 24K. Exchange Rates gold price graph 2025
- In July 2025, 24-K gold traded around Tk 403,581–416,181 per ounce. Exchange Rates
- On 19 October 2025 the Bangladesh Jewellers Association set a new record for 22-karat at Tk 217,382 per bhori. United News Bangladesh+1
- The per-gram rate: 24K gold ~ Tk 16,647/gram on 19 Oct 2025. Live Price of Gold
Visualizing the Bangladesh Graph


6
Observations:
- The local graph mirrors global upward trend but with sharper jumps, owing to local currency effects, import cost, domestic demand.
- Seasonal peaks often coincide with festival periods (weddings, Ramadan etc.) but 2025 shows unusually high baseline.
- Local highs in October signal not just seasonal but structural price upward shift.
Key Drivers Behind the Surge
The following factors combine to push gold prices higher in 2025:
1. Global macro-economic uncertainty
- A weaker US dollar, low/uncertain interest rates, inflation fears. World Gold Council+1
- Geopolitical risks and safe-haven demand (tariffs, Middle-East tensions). Financial Times+1
2. Central bank buying & investor flows
- Central banks are aggressively buying gold, reducing supply and adding upward momentum. World Gold Council+1
- Gold ETFs and investor demand have increased substantially in 2025.
3. Local currency & import cost effects (for Bangladesh)
- Bangladeshi Taka depreciation and higher import duties/charges on gold imports increase domestic rates even more than global price.
- Jewelry demand in Bangladesh remains high; as supply cost rises, retailers raise rates accordingly.
4. Seasonal and cultural demand factors
In Bangladesh, gold is culturally important (weddings, festivals, investment) so demand surges periodically drive local price spikes, compounding global trend.
5. Forecasts & momentum psychology
With forecasts of US $4,000/oz or higher, speculative interest increases. Uptrend self-reinforces as investors seek to get ahead of expected higher prices. LiteFinance+1
Forecasts & What to Expect Next
Global Outlook
- Goldman Sachs: US $3,700/oz by end-2025; trending toward US $4,000/oz in 2026. Goldman Sachs
- J.P. Morgan: Average US $3,675 in Q4 2025, climbing toward US $4,000 in mid-2026. JPMorgan Chase
- Deutsche Bank: Forecast raised to US $4,000/oz for 2026. Reuters
- WGC & others: demand remains strong, with value demand up ~45% year-on-year in Q2. World Gold Council
Bangladesh Outlook
- With global price rising and local cost factors (import duties, exchange rate) in play, Bangladesh’s local gold price likely to continue rising.
- Expect local bhori/bhori linked rates to set fresh records. As of October, already crossed Tk 217,000 for 22K. United News Bangladesh+1
- If global hits US $4,000/oz, local price could cross high angels of Tk 20 lakh/oz (depending on currency).
Risks & Corrections
- If US interest rates rise or dollar strengthens, gold may pause or correct. HSBC pointed out that dollar strength could limit gains. Reuters
- Supply chain disruptions easing, or central banks reducing demand could temper the surge.
- Local specific risk: Bangladeshi import policy changes, tax/ duty hikes, regulatory interventions may affect local price.
How to Read the Gold Price Graph
When you view a gold price graph, consider:
• Time-axis (X) vs Price-axis (Y)
Check the period displayed: full year 2025, quarterly, monthly. Note if the Y-axis is logarithmic or linear (linear shows steep slope for big gains).
• Key inflection points
Vertical jumps often correspond to major events (e.g., crossing US$3,000/oz, mid-year policy shifts).
Check annotations if available.
• Trend line vs volatility
Look for whether gold’s up-trend is smooth or marked by spikes and drops. Spikes = often news/rumour driven; smoother climb = structural demand.
• Relative magnitude
Compare percentage gains rather than only absolute levels. For example: global +60% in 2025, local Bangladesh +50%+.
• Compare global vs local lines (if chart offers both)
This highlights import-cost, currency, demand effects in local context.
• Forecast or projection overlay
Some charts include forecast ranges (shaded zones) – useful to gauge where prices may go.
Implications for Stakeholders
For Investors
- Gold remains one of the best-performing assets in 2025 – early figures indicate potential +50%+ gain.
- Consider allocation in portfolio as hedge against inflation, currency risk, geopolitical turmoil.
- But price high – risk of correction. Diversify and set target/exit levels.
- For Bangladesh investors: local gold jewellery or bars may offer dual value (asset + cultural).
For Consumers (Bangladesh)
- If you plan jewellery purchases (weddings, gifts), rising cost implies higher spending. Consider buying early or opting for lower karat.
- Investment in gold (bars, coins) should factor in local premiums, import duty, storage cost.
- As prices surge, demand may surge too – but ensure authenticity, purity and trust the seller.
For Economy & Policy Makers
- Rising import cost of gold impacts gold trade and current account (Bangladesh heavily depends on imported gold).
- Jewellery industry will face higher input cost; margins may squeeze or be passed to consumers.
- Policy implications: central bank may consider import restrictions or duty reviews; currency weakness plays a big role.
- For asset markets, gold’s surge may reflect lack of confidence in equities/other assets.
Comparative Table: Global vs Bangladesh Gold Price Trends 2025
| Metric | Global (USD per oz) | Bangladesh (Tk per oz / bhori) |
|---|---|---|
| Peak early Oct 2025 | US $4,347.29/oz Trading Economics | Tk ~ 217,382 per bhori (22K) United News Bangladesh |
| Y/Y gain | ~60% Trading Economics+1 | 22K gold crossed record in Oct; monthly range already high Exchange Rates+1 |
| Forecast end-2025 | USD $3,700-4,000/oz Goldman Sachs+1 | Local prices likely to continue upward – no specific forecast but trend strong |
| Key drivers | Safe-haven demand, central banks, dollar weakness | Global drivers + local currency, import cost, jewellery demand |
| Risk factors | Strong dollar, rate hikes | Same globally + local regulatory/import issues |
Frequently Asked Questions (FAQs)
Q1: Why is gold price rising so much in 2025?
A: A combination of macro-economic uncertainty, weaker dollar, central-bank demand and investor flight to safe-havens. World Gold Council+1
Q2: Will gold continue rising beyond 2025?
Yes, many analysts forecast further gains. For example, gold forecasted to reach USD $4,000/oz or more in 2026. JPMorgan Chase+1 gold price graph 2025
Q3: What about gold price in Bangladesh?
Local gold rates have soared, e.g., 22-karat price at Tk 217,382 per bhori in Oct 2025. The local graph mirrors the global surge but is also influenced by Taka value and import cost. United News Bangladesh+1 gold price graph 2025
Q4: Should I buy gold now?
It depends on your objective. As a hedge, yes — but recognize price is near record highs and could correct. For consumers buying jewellery, watch your budget and perhaps consider buying smartly (e.g., lower karat, good purity). gold price graph 2025
Q5: How do I read the gold price graph effectively?
Focus on trend lines, see how fast price is rising, note inflection points, compare global vs local charts, and be aware of forecast overlays (see section on Reading the Graph). gold price graph 2025
Conclusion
The “gold price graph 2025” tells a compelling story — one of a metal reclaiming its role as a leading asset in times of uncertainty, and of a local market (Bangladesh) absorbing global momentum and local cost pressures to drive record highs. gold price graph 2025
For investors, this year may mark a once-in-a-decade opportunity, while for consumers and policymakers it flags both opportunities and risks. As we move toward end-2025 and into 2026, continuing to monitor the graph — the curves, the spikes, the forecasts — will be essential. gold price graph 2025
Whether you read it as investor, consumer or economist, the gold price graph of 2025 is a vivid chart of our times: inflation, geopolitics, currency dynamics, demand shifts — all reflected in gleaming bullion. gold price graph 2025